Journal — StormNet
Seventeen and a half hours of ice
On January 24–25, 2026, a two-phone rig in Clemson recorded a real ice storm end to end. Here is the dataset and its limits.
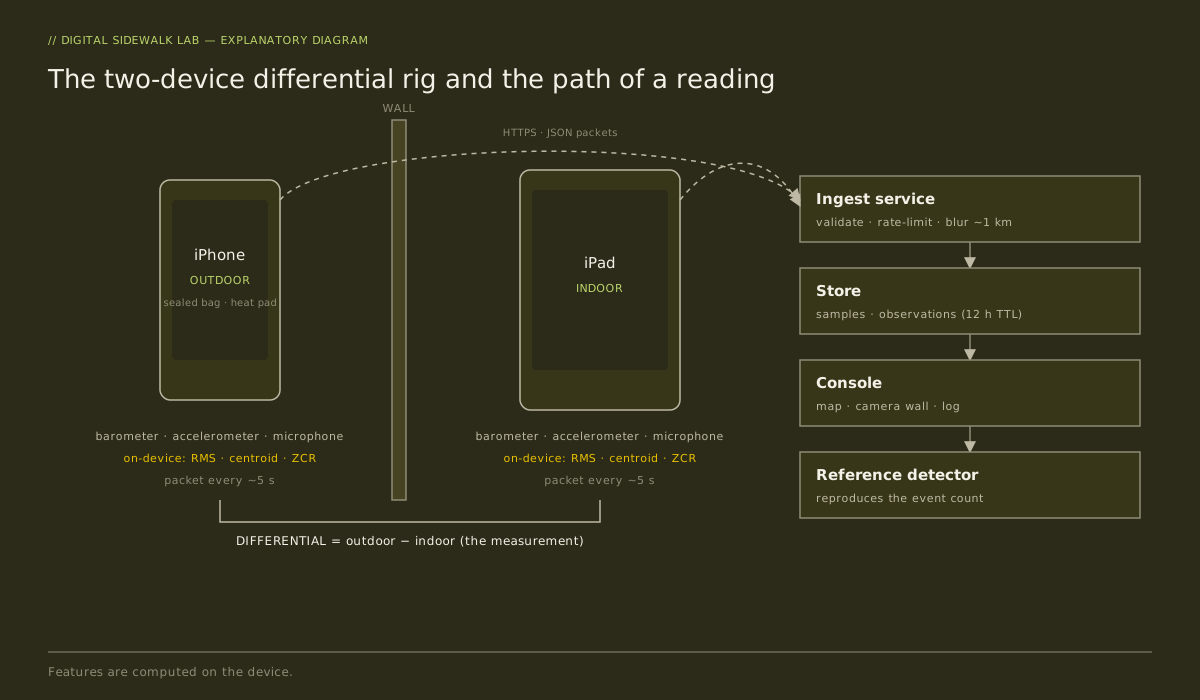
The field test's first real event was an ice storm that crossed the Clemson area over the night of January 24 into January 25, 2026. The rig ran through it. This entry publishes what it recorded, and, just as carefully, what it did not.
The rig
Two consumer devices ran the same sensor app. An iPhone 13 Pro Max was placed outdoors near a door, inside a sealed bag with a heat blanket so the battery would survive the cold. An iPad Pro 11-inch stayed indoors in a stable spot. Each device sampled its barometer and accelerometer and its microphone. From the microphone it computed three summary features on the device, root-mean-square level, spectral centroid, and zero-crossing rate, and posted a packet roughly every five seconds to a small ingest service. Raw audio never left either device. That is a privacy rule, and it is also a data limitation.
The pair was designed as a differential. The outdoor unit hears the weather; the indoor unit hears the same weather through the building. The difference between them is the quantity of interest.
What it recorded
- 23,451 samples over about 17.5 hours, exported as one CSV file.
- A barometric drop of roughly 10.8 hectopascals across the passage of the front.
- 82 outdoor audio events flagged as spikes against the pre-storm baseline; the loudest reached several tens of times the baseline level.
- A shift in the outdoor spectral centroid toward roughly 3,500 to 3,900 hertz during periods manually tagged as sleet and ice, compared with a lower centroid during rain.
The spectral centroid is the frequency at which the energy of a sound balances, a single number that rises when high-frequency content increases. Ice on hard surfaces is a high-frequency sound; rain is not. The centroid moved the way that physics would predict.
What it does not establish
The microphones were not calibrated against a reference, so levels are relative to each device, not absolute. The barometric readings are the devices' own uncorrected sensors. Timestamps are device clocks. Manual precipitation tags were made by one observer. The event count depends on a threshold choice that is documented in the reference detector shipped with the data, and a different threshold gives a different count.
Data is presented with stated limits. The file is released under a Creative Commons Attribution license alongside the open-source platform, with a reference detector that reproduces the event count from the file so that anyone can check it or replace it.